Q is discharge in L/s, h is water level in mm above the notch crest, g = 9.81 m/s², and the default Cd is 0.58. The coefficient can be changed in 'Weir controls' in the 'Plot explorer' tab.
1 m3 = 1,000 litres. An Olympic swimming pool is approximately 2,500 m3.
About this plot
Legend
Use the checkbox next to each layer to show or hide it. Core weather and weir layers are off by default in the Plot explorer.
About this plot
This plot shows empirical cumulative-frequency curves for loaded well water levels as height above ground level.
The x-axis is water level height in cm above ground level; the y-axis is the cumulative percentage of observations at or below that level.
The dashed vertical line marks ground level at 0 cm. Manual dip and logger records are kept as separate curves so high-frequency logger records do not swamp the manual observations.
When Compare years is active, each install/source is split by calendar year. If a moving-window summary has been added, the cumulative frequency of the computed centre line is also shown.
Legend
Use the checkbox next to each layer to show or hide it. Core weather and weir layers are off by default in the Plot explorer.
Display controls
Weir controls
Water-level datum
Moving-window summary
Adds a seasonal summary curve for the loaded manual dip data. For each point on the curve, the app takes all measurements within a moving day-of-year window across the record and calculates a centre line and spread. This helps show the typical seasonal water-level pattern while smoothing out individual readings.
Logger drift correction
install_name against the Hinksey Heights hydro installs, checks null-level codes where a depth is blank, then writes both records.imports and hydro_monitoring.dips using the logged-in database connection.-
install_name,dip_date_time,dip_depth_topare required. -
Optional:
dip_measurer,dip_notes,dip_null. -
dip_date_timeshould useyyyy-mm-dd hh:mm, e.g.2026-06-04 13:30. -
If
dip_depth_topis blank,dip_nullmust contain a valid code fromlookups.lookup_dips_null.
records.imports, hydro_monitoring.logger_imports and hydro_monitoring.logger_data using the logged-in database connection.-
Choose one or more
.csvfiles exported from WinSitu. - The Files tab shows preview status; select a row to inspect the file.
- The selected file populates the Log file plot and Log file raw data tabs.
- Barometric files are imported before water-level files when several files are uploaded together.
- The CSV time zone is assumed to be UTC unless changed below. The elapsed-seconds counter is used by default to avoid DST ambiguity.
Freshwater Habitats Trust began monitoring hydrology at Hinksey Heights Nature Reserve in March 2024, when a network of monitoring wells was installed. The monitoring network now includes a flow gauging weir, installed in April 2026, to measure the volume of water flowing out of the valley.
This dashboard makes the data collected accessible to local people, volunteers, land managers and scientists. It brings together manual water-level measurements, logger data, flow estimates and meteorological data so that patterns can be explored as the dataset grows. All data are free to download.
- track long-term seasonal water-level trends;
- understand how the site functions hydrologically;
- assess the effects of management and restoration;
- explore the relationship between biodiversity and hydrology; and
- understand wider catchment function.
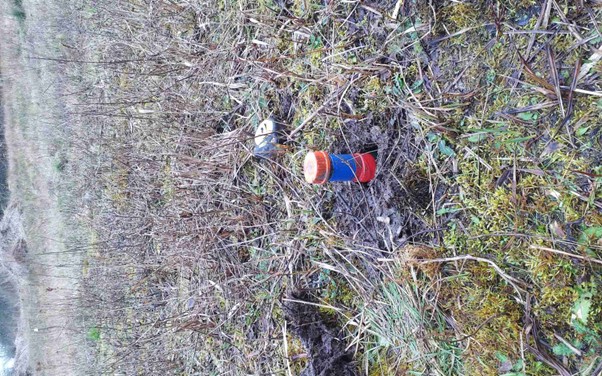
Wells are used to monitor surface water levels across the site. These comprise a short length of blue slotted plastic piping, typically 1 metre, with a cap (painted orange).
There are 22 wells in the wetland substrate. One functions as a shallow piezometer where the water is under pressure (the tall well visible from the boardwalk on the golf course side). Three further wells are installed as stilling wells in the stream, reducing short-term turbulence around the measuring point.
Water levels are recorded manually once a week by volunteers. These measurements provide a long-term record of seasonal change and spatial differences in wetness, and validate higher-frequency measurements by data loggers.
A subset of wells is fitted with data loggers, with seven currently installed. These record pressure every hour, which is converted to water depth. A barometric logger in the nature reserve records on-site atmospheric pressure and ambient temperature.
Taken together, these data help show where soils remain wet through the year, where water levels fluctuate strongly, hydraulic gradients across the site including interactions between wetland areas and the stream, and how different parts of the site respond to weather and management.
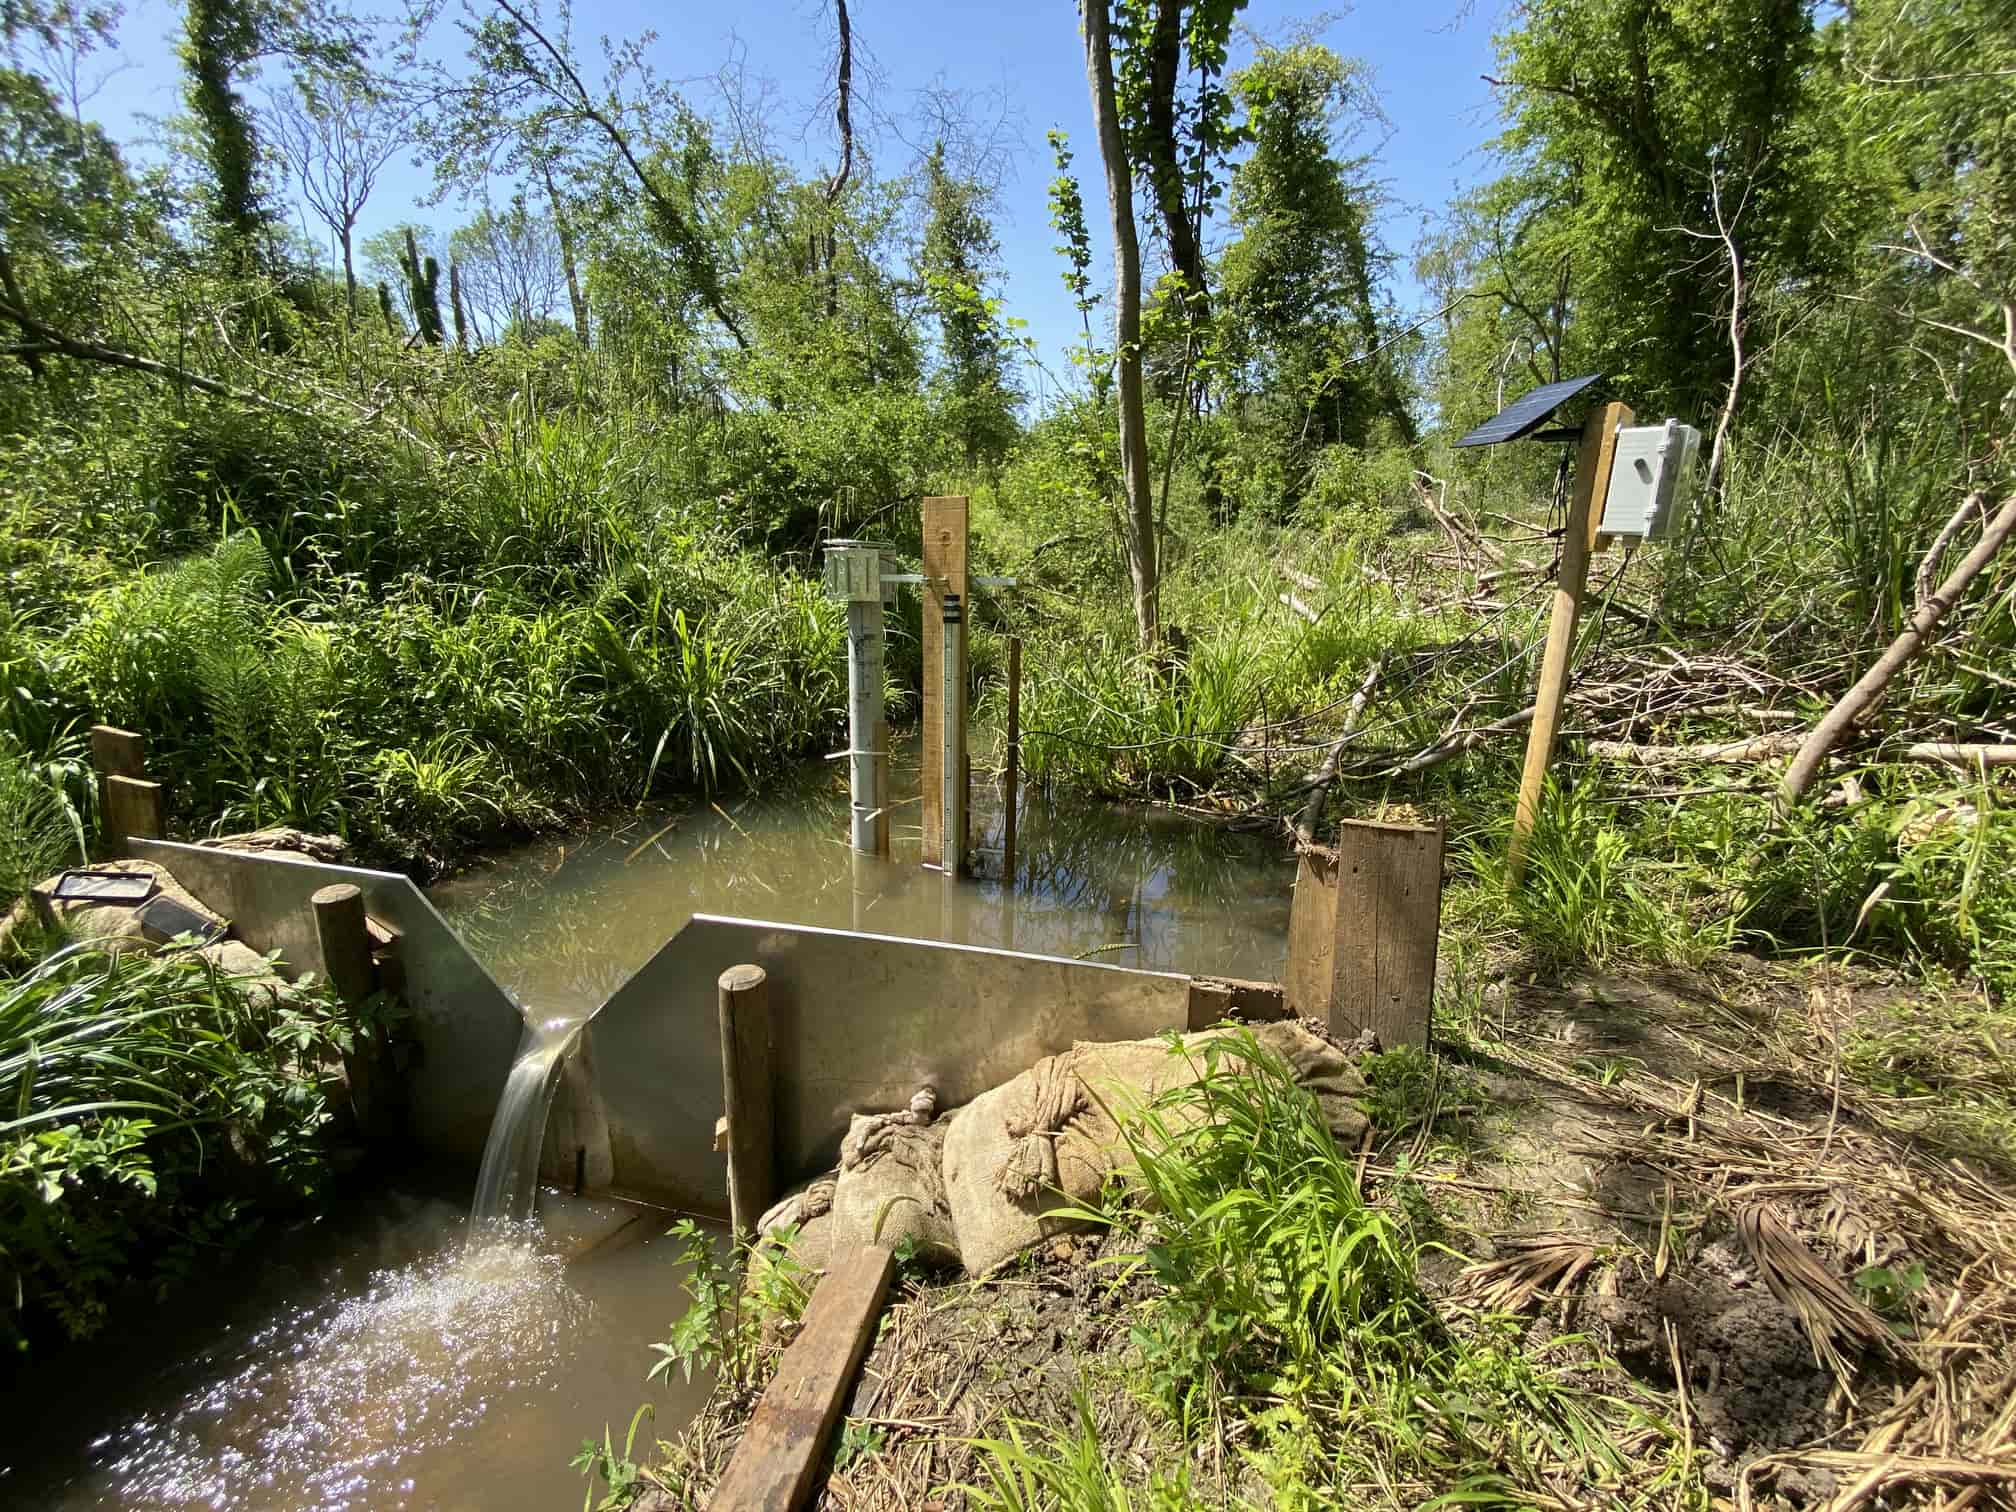
The outfall weir was installed in the stream in April 2026. It uses a defined cross-section (a 90° V-notch) so that water level can be converted to discharge: the volume of water flowing per unit time. The location is more-or-less at the end of the main valley, downstream of all the wetland areas, so that it captures all the water generated by the site's springs and other inflows.
A telemetry system, using an ultrasonic sensor connected to the internet, reports water level automatically and allows near-real-time estimates of discharge and flow volume.
The weir is especially important for understanding the wider catchment function of the site. It shows how the volume of water leaving the valley changes through time, including during storm events and dry periods. It also helps us understand the relative contribution of different sources to the site’s hydrology, including springs, rainfall, runoff and stream inputs.
Meteorological data in the dashboard come from the weather station at Hinksey Heights Golf Club. These data provide context for interpreting water-level and flow patterns, particularly rainfall and temperature, which help explain seasonal changes in evaporation demand. The station does not measure evapotranspiration directly.
The monitoring network can be expanded as new questions arise. At present, there are limited data on water chemistry, which are not currently included in the dashboard. There are also no water-level data from the site's catchment outside the nature reserve.
The data are intended to support interpretation. As the monitoring record lengthens, it will become increasingly useful for detecting seasonal patterns, unusual events and longer-term hydrological change.